

What Are the 2026 Best Large Scale Solar Solutions?
What will define the best large scale solar solutions in 2026? The answer is no longer a module efficiency chart. It is a field-tested combination of yield, grid access, storage, durability, and bankable execution. IRENA’s Renewable Capacity Statistics 2025 reports about 452 GW of solar capacity added worldwide in 2024. Solar reached roughly 1,865 GW globally. That scale changes procurement decisions. A project near a congested substation can lose more value than it gains from a slightly better panel. The International Energy Agency’s Renewables 2024 analysis also expects solar PV to dominate new renewable capacity through 2030. Yet forecasts are not contracts.
Leading 2026 designs will likely pair high-efficiency bifacial modules with single-axis trackers, robust power electronics, and carefully sized battery energy storage. Lazard’s Levelized Cost of Energy+ Version 17.0 places utility-scale solar among the lowest-cost new-build generation options. However, financing and site conditions can significantly change those figures. NREL’s Annual Technology Baseline shows why assumptions matter. Degradation, curtailment, interconnection, and replacement costs can reshape lifetime economics. Small details become visible in operation. Dust on a glass surface, a failed tracker motor, or a two-hour evening price spike can change the revenue model. The strongest solutions will be compared through measured availability, modeled energy yield, safety records, and transparent warranties. No ranking is perfect. A project with impressive peak output may underperform during cloudy mornings or constrained export periods. This guide examines PV-plus-storage, hybrid solar plants, and grid-supportive controls. It also questions a common shortcut: choosing the cheapest equipment before confirming the grid study. Experience suggests that “best” means dependable energy at the right hour, not maximum nameplate capacity.
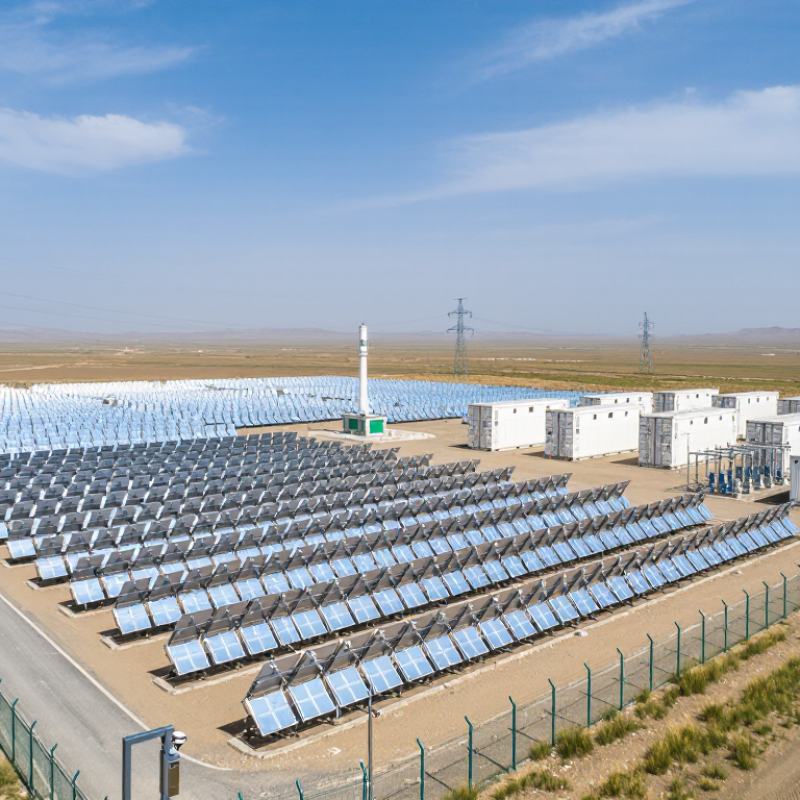
Table of Contents
[Hide]
Defining Large-Scale Solar Solutions for 2026
What Are the 2026 Best Large Scale Solar Solutions?
Defining Large-Scale Solar Solutions for 2026
In 2026, a large-scale solar solution means more than rows of photovoltaic modules. It combines generation, grid connection, forecasting, storage, land planning, and long-term operations. Experienced project teams begin with local conditions: hourly sunlight, soil stability, dust, rainfall, and transmission capacity. A site may produce excellent noon output yet struggle during evening demand. That gap matters.
Practical planning now uses 15-minute production models, not annual averages alone. Engineers can compare fixed-tilt and tracking structures, then test curtailment, heat losses, and battery dispatch. Storage is not automatically the answer. Its value depends on market rules, interconnection limits, cycle life, and replacement costs. Good teams document assumptions and publish sensitivity ranges. Confidence needs evidence.
Reliable projects also include remote monitoring, inspection routines, spare-parts plans, and trained field technicians. Cybersecurity and worker safety belong in the design, not in a late checklist. Environmental studies should examine drainage, habitat, glare, and end-of-life material recovery. A low-cost bid can become expensive after one failed inverter or delayed permit. That lesson is easy to miss. Even sophisticated forecasts remain imperfect when weather shifts or demand changes. The stronger 2026 solution is adaptable, measurable, and transparent about uncertainty.
What Are the 2026 Best Large-Scale Solar Solutions?
Defining large-scale solar solutions for 2026 through performance, cost, land use, grid value, and deployment flexibility
| Solar Solution | Typical Utility-Scale Configuration | Indicative Capacity Factor | Indicative Land Requirement | Key 2026 Strength | Main Limitation | Best-Fit Application |
|---|---|---|---|---|---|---|
| Bifacial PV with Single-Axis Tracking | Ground-mounted photovoltaic arrays using bifacial modules and horizontal single-axis trackers | Approximately 24%–38% | About 1.5–3.5 hectares per MWac, depending on terrain, layout, and setbacks | High energy yield, mature supply chain, scalable construction, and strong performance in regions with good solar resources | Variable generation requires grid flexibility, storage, transmission, or complementary generation | Large projects in high-irradiance areas with available transmission capacity |
| Fixed-Tilt Utility-Scale PV | Ground-mounted photovoltaic arrays installed at a fixed orientation and tilt angle | Approximately 18%–30% | About 1.5–3.0 hectares per MWac | Lower mechanical complexity, reduced maintenance requirements, and suitability for uneven or constrained sites | Usually produces less annual energy than tracking systems at the same installed capacity | Projects with challenging terrain, lower wind conditions, or a preference for simpler operation |
| PV Plus Battery Energy Storage | Utility-scale PV paired with lithium-ion or other grid-scale battery storage systems | PV output remains site-dependent; storage commonly provides 2–8 hours of rated discharge | PV land requirement plus approximately 0.1–0.4 hectares per MW of battery power, subject to design | Shifts solar energy into higher-value periods, reduces curtailment, and improves dispatchability and grid support | Higher capital cost, battery degradation, thermal management needs, and replacement planning | Congested grids, evening peak markets, renewable-rich regions, and projects facing solar curtailment |
| Agrivoltaic Solar | Elevated or widely spaced PV arrays installed above or beside active agricultural production | Approximately 15%–30%, depending on array density, orientation, and crop requirements | Typically 2–6 hectares per MWac because of wider spacing, access lanes, and agricultural buffers | Combines electricity production with crop, grazing, or pollinator uses and can reduce land-use conflicts | More complex engineering, agricultural coordination, permitting, and potentially higher construction costs | Regions where land competition, water stress, or agricultural preservation is important |
| Floating Solar PV | PV modules mounted on floating platforms installed on suitable reservoirs, quarry lakes, or other calm inland waters | Approximately 20%–35% | Approximately 1.0–2.5 hectares of water surface per MWac, depending on spacing and system design | Uses non-terrestrial space, may reduce water evaporation, and can benefit from nearby hydropower or transmission infrastructure | Anchoring, corrosion, water-level variation, wave exposure, ecological review, and specialized maintenance requirements | Water bodies near substations or hydropower facilities where land is scarce |
| Concentrated Solar Power with Thermal Storage | Solar thermal collectors, heat-transfer systems, thermal storage tanks, and a steam turbine or power block | Approximately 35%–55% | About 2–5 hectares per MW, depending on technology and storage duration | Provides dispatchable renewable electricity after sunset and can supply longer-duration storage than many short-duration batteries | Requires strong direct normal irradiance, high upfront investment, water-management planning, and longer development timelines | Very sunny regions with evening demand, limited short-duration storage, or a need for firm renewable output |
| Hybrid Solar, Wind, and Storage Parks | Co-located solar PV, wind generation, battery storage, shared transmission, and coordinated controls | Approximately 35%–65% at the shared point of interconnection, depending on resource quality and sizing | Site area varies widely; wind turbine spacing generally determines the overall land envelope | Improves utilization of transmission capacity, smooths generation profiles, and can reduce renewable curtailment | Complex resource assessment, environmental permitting, operational coordination, and higher development complexity | Areas with complementary daytime solar and nighttime or seasonal wind resources |
Note: Values are indicative planning ranges derived from commonly reported utility-scale solar design characteristics. Actual results depend on solar resource, module efficiency, tracker geometry, terrain, grid interconnection, storage duration, permitting conditions, and local construction practices.
Related Posts
-
Why Choose Large Scale Solar for Global Projects?
-
China Top 10 Large Scale Solar Suppliers for Global Buyers?
-
Why Invest in Solar Projects for Your Business Growth?
-
How to Choose the Best Project Solar Solutions for Your Needs?
-
2026 Top Sun Value Solar Trends for Global Buyers Insights?
-
Top Solar Systems in China for Global Buyers 2026?