Choosing utility scale solar panels globally is no longer a simple comparison of wattage and price. In 2023, solar power added approximately 346 gigawatts worldwide, raising global installed capacity to about 1,419 gigawatts, according to IRENA’s Renewable Capacity Statistics 2024. This scale creates opportunity, but it also exposes weak procurement decisions quickly. A module that performs well in a dry desert may struggle under coastal salt, tropical humidity, snow, or unstable grid conditions.
A reliable selection process should examine energy yield, degradation, temperature coefficient, bifacial gain, mechanical loading, and long-term warranty credibility. The IEA’s Renewables 2024 report identifies solar PV as the leading source of new renewable capacity growth through 2030. Therefore, buyers need more than a low factory quotation. They should request independent test results, production history, traceability records, and evidence from operating utility scale projects. PVEL’s Module Reliability Scorecard also shows why reliability testing matters, especially for thermal cycling, damp heat, and mechanical stress.
Field reality matters most.
Site conditions should guide the shortlist. A high-albedo desert project may benefit from bifacial modules, while a humid site demands stronger moisture protection and corrosion resistance. Large formats can reduce installation costs, yet they may increase handling risks and structural requirements. No technology choice is perfect. Early assumptions about cleaning frequency, tracker compatibility, or degradation can quietly weaken project returns. Developers should model several scenarios using measured weather data, realistic losses, and conservative warranty assumptions. The best panel is not always the newest or cheapest. It is the one that delivers dependable electricity across the project’s full operating life.
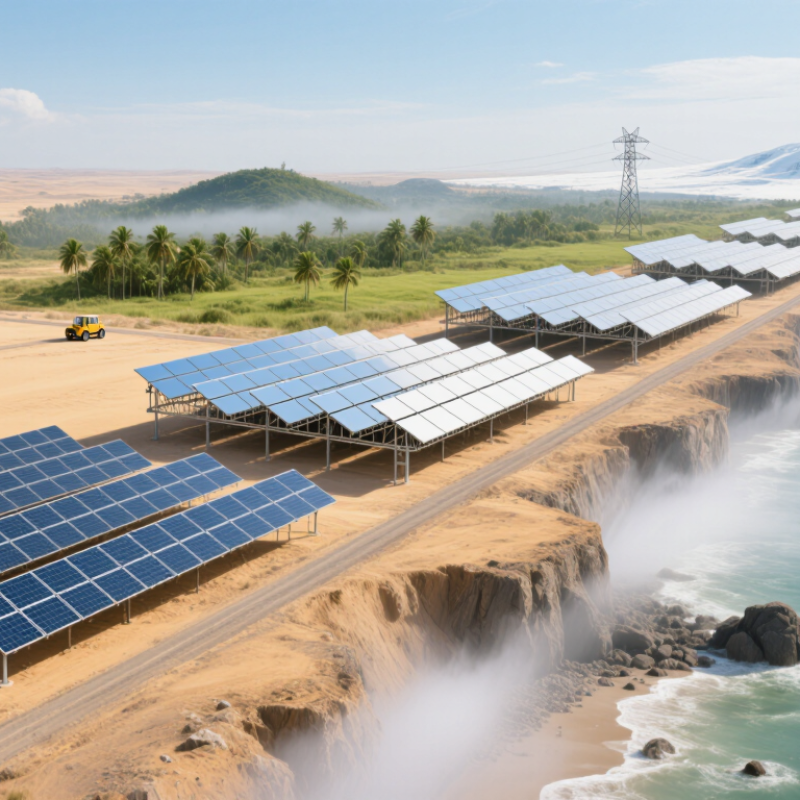
Choosing utility-scale solar panels begins with the project, not the product sheet. Define the target capacity, delivery date, grid-connection point, land limits, and expected energy yield. The IEA PVPS Trends 2024 report recorded about 456 GW of new photovoltaic capacity worldwide in 2023. That growth increases competition for suitable sites and equipment. A strong requirement document should specify annual generation, operating temperature, wind and snow loads, humidity, salt exposure, and cleaning conditions.
Site conditions decide more than many early designs admit. Measure irradiance, shading, soil stability, flood risk, and access for heavy transport. Specify a realistic degradation assumption, such as 0.4% to 0.5% annually, then test its effect on lifetime revenue. Module efficiency matters, but land productivity and temperature behavior may matter more. Use independent yield assessments and conservative loss factors. A perfect datasheet is not enough.
Grid requirements must be written in engineering language. Define voltage, frequency response, reactive power, protection settings, harmonics, and communication interfaces before procurement. IRENA’s Renewable Power Generation Costs in 2023 reported a global weighted average utility-scale solar LCOE of about USD 0.044 per kWh. That figure is useful, but local financing, curtailment, taxes, and transmission costs can change the result sharply. Require third-party testing, traceable documentation, warranty clarity, and replacement planning. Field assumptions are often too optimistic. Recheck them.
How to Choose Utility Scale Solar Panels Globally?
Utility-scale selection starts with measured performance, not brochure efficiency. The IEA PVPS Trends 2024 report recorded about 456 GW of new photovoltaic capacity in 2023. That scale makes small design errors expensive. Crystalline silicon remains dominant, with mainstream modules exceeding 22% efficiency according to the Fraunhofer ISE Photovoltaics Report 2024. Higher efficiency reduces land, racking, cable, and installation requirements.
Technology choice still depends on climate. TOPCon and heterojunction modules can provide strong efficiency and bifacial output. Bifacial systems often gain 5–15% energy, depending on ground reflectance, spacing, and tracker design. Thin-film modules may perform better in high heat or diffuse light, despite lower nameplate efficiency. The right result is project-specific.
Temperature matters. Soiling matters more than many models admit.
The NREL 2024 PV Lifetime project literature commonly uses degradation assumptions near 0.5% annually for crystalline silicon systems, although field results vary. I would therefore compare warranties with independent degradation data, not accept a single laboratory number. Check winter irradiance, wind loading, humidity, hail exposure, and cleaning access at the actual site. A module with higher efficiency may lose its advantage when replacement logistics are difficult. This is where a spreadsheet can mislead. Five-year operating evidence may be more valuable than another decimal point of rated power.
Choosing utility-scale solar panels globally starts with the site, not a product sheet. Measure annual irradiance, seasonal cloud cover, shading, and horizon obstructions across the full field. A small ridge can change row spacing and winter output. Use ground measurements where possible, then compare them with several long-term climate datasets. One source is not enough. Data gaps happen.
Regional climate determines which panel characteristics matter. In hot deserts, high operating temperatures reduce voltage and energy yield, so temperature behavior needs careful modeling. Fine dust can settle on glass within days. Inspect cleaning water, access roads, and soiling rates before selecting a design. Coastal sites face salt spray and persistent humidity. Request corrosion testing and examine drainage around mounting structures. In cold regions, snow loading, freeze-thaw cycles, and low winter sun require different mechanical and electrical assumptions. Strong seasonal winds also affect tracker stability and row layout. Monsoon zones demand attention to flooding, lightning, and rapid moisture changes. The land may look dry in April and become inaccessible in August.
A reliable evaluation combines site walks, independent engineering review, and conservative yield simulations. Check measured wind, snow, temperature, and humidity records against local terrain. Ask whether the panel design has been tested under the actual climate, not only a laboratory average. I would also model a poor-cleaning year and a hotter-than-normal year. That feels less optimistic, but it is more useful for financing and operations. No model is perfect. Revisit assumptions after one season of field data.
| Region and Typical Site | Climate Profile | Typical Global Horizontal Irradiation | Typical Ambient Temperature Range | Primary Environmental Risks | Recommended Panel Characteristics | Key Design and Installation Priorities | Indicative Annual Specific Yield |
|---|---|---|---|---|---|---|---|
| Southwestern United States Arizona, Nevada, New Mexico |
Hot desert; very high solar resource; low annual rainfall. | 2,000–2,600 kWh/m²/year | −10°C to 48°C | High heat, dust, sand abrasion, strong ultraviolet exposure, occasional flash flooding. | Low-temperature-coefficient modules, strong UV resistance, durable backsheets or glass-glass construction, and high resistance to dust accumulation. | Use thermal derating studies, optimized row spacing, automated or semi-automated cleaning where water is limited, and flood-aware civil design. | 1,700–2,200 kWh/kWp/year |
| Atacama Desert Northern Chile and Southern Peru |
Extremely arid desert; among the highest solar resources globally. | 2,400–3,000 kWh/m²/year | 0°C to thirty-five°C | Severe dust, high UV exposure, large day-night temperature swings, and limited water availability. | High UV durability, strong mechanical loading capability, low soiling sensitivity, and robust electrical insulation performance. | Prioritize dry-cleaning strategies, corrosion testing for coastal or mineral-rich dust, high-altitude derating where applicable, and tracker protection against abrasive dust. | 2,000–2,600 kWh/kWp/year |
| Mediterranean Europe Spain, Italy, Greece |
Sunny temperate climate; dry summers and wetter winters. | 1,600–2,100 kWh/m²/year | −5°C to 42°C | Seasonal soiling, heat waves, wildfire smoke, hail, and occasional high winds. | Modules with good heat performance, certified hail resistance, reliable fire-performance documentation, and moderate-to-high wind-load capability. | Model summer heat losses, maintain vegetation and firebreaks, inspect after hail events, and design drainage for intense winter rainfall. | 1,400–1,850 kWh/kWp/year |
| Northern Europe United Kingdom, Germany, Netherlands |
Cool, cloudy, and seasonally variable; diffuse light is significant. | 900–1,250 kWh/m²/year | −20°C to thirty-five°C | Low winter sun, frequent cloud cover, snow in some areas, humidity, and wind-driven rain. | Strong low-light response, low operating-temperature tolerance, certified resistance to humidity and potential-induced degradation, and robust snow-load ratings. | Optimize tilt and row spacing for winter irradiance, assess snow shedding, use corrosion-resistant mounting systems, and account for high diffuse-light fractions. | 850–1,200 kWh/kWp/year |
| Middle East Saudi Arabia, Jordan, United Arab Emirates |
Hot desert; intense sunlight, very low rainfall, and frequent dust events. | 1,900–2,700 kWh/m²/year | 5°C to 50°C | Extreme heat, sandstorms, heavy soiling, abrasive particles, and water scarcity. | Low-temperature-coefficient modules, abrasion-resistant front glass, strong sealing, reliable high-voltage insulation, and tested performance under high humidity and heat. | Specify cleaning frequency from measured soiling rates, evaluate robotic or dry-cleaning options, limit thermal hotspots, and use dust-resistant tracker components. | 1,650–2,300 kWh/kWp/year |
| India Rajasthan, Gujarat, Deccan Plateau |
Hot tropical to semi-arid; strong sunlight with seasonal monsoon rainfall. | 1,600–2,200 kWh/m²/year | 5°C to 48°C | Heat, dust, monsoon humidity, intense rain, flooding, and localized hail. | Low-temperature-coefficient modules with strong damp-heat resistance, robust drainage design, high humidity resistance, and suitable mechanical loading. | Design for monsoon drainage, elevated equipment where flooding is possible, regular soiling measurement, and corrosion protection for humid periods. | 1,400–1,900 kWh/kWp/year |
| Southeast Asia Thailand, Vietnam, Malaysia, Indonesia |
Humid tropical; high rainfall, high humidity, and substantial cloud cover. | 1,300–1,800 kWh/m²/year | 18°C to 38°C | High humidity, heavy rain, corrosion, algae or biological growth, lightning, and typhoons in exposed areas. | Excellent damp-heat resistance, strong PID resistance, corrosion-resistant materials, reliable encapsulation, and high wind-load certification. | Use enhanced drainage and ventilation, specify corrosion-resistant structures, protect cable connectors from water ingress, and perform frequent insulation testing. | 1,150–1,550 kWh/kWp/year |
| Northern Australia Queensland, Northern Territory |
Hot tropical and monsoonal; strong sunlight with wet and dry seasons. | 1,800–2,300 kWh/m²/year | 10°C to 45°C | Cyclones, high humidity, salt exposure near the coast, heat, and intense rainfall. | High wind-load capability, impact-resistant glass, strong damp-heat performance, corrosion-resistant frames, and secure cable management. | Complete cyclone-specific structural analysis, use elevated drainage paths, protect against salt mist, and verify tracker stow behavior during severe weather. | 1,550–2,000 kWh/kWp/year |
| Southern Africa South Africa, Namibia, Botswana |
Semi-arid to desert; generally high irradiance with seasonal rainfall. | 1,800–2,500 kWh/m²/year | −5°C to 45°C | Dust, high UV exposure, heat, wind, wildlife, and occasional intense storms. | Strong UV durability, low-temperature coefficient, robust mechanical design, and resistance to dust-related power losses. | Assess dry-cleaning requirements, secure cables against wind and animals, design stormwater channels, and evaluate tracker performance under dusty conditions. | 1,550–2,150 kWh/kWp/year |
| Canada and Northern United States Prairie and high-latitude regions |
Cold continental; strong summer production and low winter sun. | 1,000–1,500 kWh/m²/year | −40°C to 35°C | Heavy snow, freeze-thaw cycles, ice, hail, high winds, and limited winter daylight. | High snow-load rating, strong low-temperature performance, reliable cold-start electrical design, hail resistance, and durable junction boxes. | Model snow losses rather than only annual irradiation, provide suitable tilt for snow shedding, protect foundations from frost heave, and verify tracker operation in freezing conditions. | 900–1,350 kWh/kWp/year |
| Coastal and Island Sites Global coastal zones |
Solar resource varies widely; marine atmosphere with elevated humidity and salt. | Site-specific; commonly 1,200–2,200 kWh/m²/year | 5°C to 40°C | Salt mist, corrosion, high winds, tropical storms, and difficult logistics. | Salt-mist-tested modules, corrosion-resistant frames and fasteners, strong wind-load ratings, and enhanced sealing of connectors and junction boxes. | Maintain adequate distance from shore where feasible, use marine-grade materials, inspect corrosion regularly, and include storm-resistant electrical and structural design. | 1,050–1,900 kWh/kWp/year |
| Selection note: These ranges are planning-level values and can vary substantially with latitude, elevation, terrain, albedo, system design, shading, soiling, snow cover, and grid-availability constraints. Final panel selection should be based on site-specific irradiance data, temperature records, wind and snow studies, corrosion classification, and an independent energy-yield assessment. | |||||||
Utility-scale solar projects demand more than impressive wattage figures. Certification documents should match the exact panel model, factory, and production site. Check recognized electrical, safety, and performance standards for every target market. A certificate with an outdated model number deserves questions. Ask for test reports, surveillance records, and the issuing laboratory’s accreditation. Do not rely on a scanned logo alone. That shortcut can become expensive.
Warranty language needs close reading before procurement begins. Separate the product warranty from the power-performance warranty, because they cover different risks. Confirm duration, degradation limits, remedies, and the process for making claims. A ten-year promise means little if the supplier cannot explain response times. Request evidence of previous claims and replacement procedures. Also examine exclusions involving transport damage, harsh climates, installation, and unauthorized repairs. Small wording matters. Have an independent technical adviser review ambiguous clauses.
Supplier quality is visible in factory controls, not only in polished presentations. Review incoming-material checks, cell traceability, electroluminescence testing, and final inspection records. A factory visit can reveal whether procedures are practiced or merely displayed. Ask how defects are isolated and how corrective actions are verified. Independent pre-shipment inspections add useful friction. Still, no audit predicts every future failure. I would combine document review, sample testing, financial checks, and local service references. When evidence conflicts, pause the purchase instead of rewarding confidence without proof.
Choosing utility-scale solar panels globally requires more than comparing purchase prices. IRENA reported that the global weighted-average LCOE for utility-scale solar fell to about $0.044 per kWh in 2023. However, cheaper modules can create hidden costs. Check certificates, factory quality records, warranty terms, and independent reliability testing. A low quotation means little if replacement parts arrive late.
Logistics can reshape the project budget. The IEA reported that solar module prices fell by almost 50% in 2023, yet freight, insurance, customs, and inland transport remain highly location-dependent. Map the route from factory to site. Count port transfers. Inspect pallet protection against moisture and impact. The World Bank’s 2023 Logistics Performance Index shows wide differences in customs efficiency and delivery reliability between markets. Build spare-module storage near the project. It may look excessive.
Long-term risk deserves harder questions. Many financial models assume annual module degradation near 0.3%–0.5%, but heat, humidity, salt, hail, and poor installation can accelerate losses. Use climate-specific testing, including salt-mist and hail evaluation, before procurement. NREL’s field research also shows that real-world degradation varies across technologies and operating environments. Models are not reality. Review performance data yearly, reserve inspection funds, and test sample modules after installation. I would not trust a 30-year forecast without local weather data and a clear replacement plan.
For utility-scale projects, n-type TOPCon and heterojunction modules generally offer higher efficiency and lower annual degradation than conventional PERC technology. Higher efficiency can reduce land, mounting, cabling, and installation requirements, while lower degradation can improve lifetime energy yield.
Final selection should compare delivered cost per watt, freight and inland logistics, customs exposure, certification requirements, temperature performance, warranty enforceability, and long-term supply-chain risk. The figures below are representative 2024 technology-level benchmarks rather than supplier quotations.